Hi all,
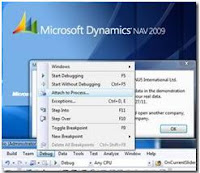
Debugging of an Add-in in the client is very simple. After the client has started up all you need to do is to attach the Visual Studio to the process of the Role Tailored client.
For debugging compile your project with the “Debug” solution configuration.
Before you open the page that contains your Add-in attach Visual Studio to the process “Microsoft.Dynamics.Nav.Client.exe”.
Now you can monitor the program flow in your Add-in code. Go ahead and set breakpoints in the implementation of CreateControl or in your implementation of the IObjectControlAddInDefinition interface.
èIf you find to do the above steps to be difficult there is an another method to do same task.
Then consider adding the following code line in the CreateControl method:
System.Diagnostics.Debugger.Launch();
This will fire up a dialog where you can pick the instance Visual Studio and for debugging and already breaks at that code line. Remember to remove this line, when you are done with debugging ;-)
I would personally suggest using first method as there is no chance of missing something in code after debugging is completed. Give it a try!

Why your topic is same of "Christian's Blog"? Does he copy from you? Check this link http://blogs.msdn.com/b/cabeln/archive/2009/09/22/how-to-debugging-of-add-ins.aspx
ReplyDelete